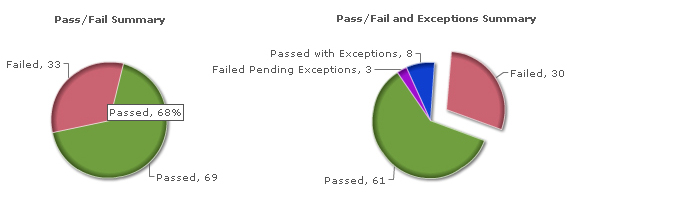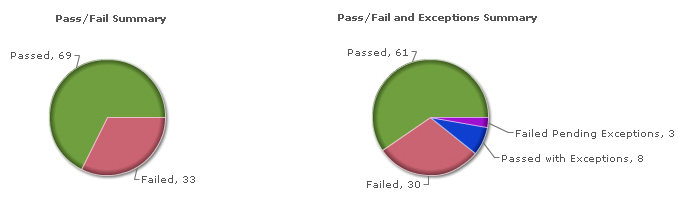
In the sample below, there are 69 control instances with a Passed status and 33 control instances with a Failed status. Out of the 69 that passed, 8 passed with exceptions. Out of the 33 that failed, 3 have pending exceptions.
The pie charts have these interactive features when viewed in HTML: 1) place your cursor over any pie slice to see the size of the slice as a percentage, 2) click on any pie slice to move the slice away from the rest of the pie chart for better visibility, and 3) rotate the pie chart by right-clicking on the chart and selecting "Enable Rotation" from the context menu.
Note that the pie charts below were rotated. The Failed slice is now at the top of the first pie chart when it was previously at the bottom. In the second pie chart, the Failed slice was moved away from the rest of the pie chart.