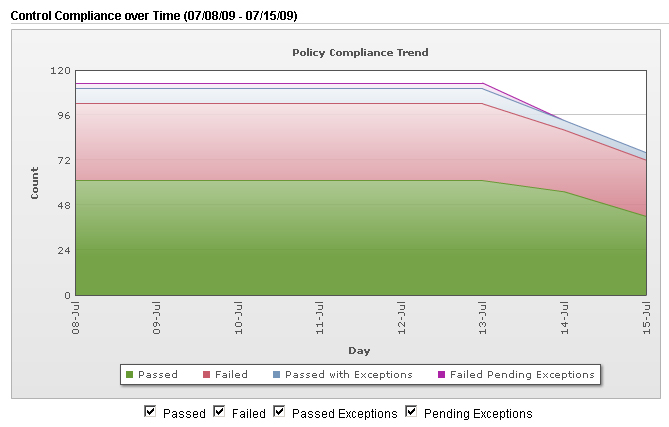
This sample shows that the total number of passed and failed control instances decreased over time. There was a total of 113 control instances on the trend start date (July 8) and 76 control instances on the report generation date (July 15). The number of control instances with a passed status on the trend start date was 61 and this decreased to 42 by the report generation date. The number of control instances with a failed status on the trend start date was 41 and this decreased to 30 by the report generation date.
Note the status level check boxes below the graph (Passed, Failed, Passed Exceptions, Pending Exceptions). For the graph above, all check boxes are selected meaning that all status levels are included in the graph.
When viewing the Policy Report in HTML, you can export the data plotted on any graph by right-clicking on the chart and selecting "Copy data to clipboard". Then paste the data into a separate document. For example, the data plotted on the graph above is:
"Day","Passed","Failed","Passed with Exceptions","Failed Pending Exceptions"
"08-Jul","61","41","8","3"
"09-Jul","61","41","8","3"
"10-Jul","61","41","8","3"
"11-Jul","61","41","8","3"
"12-Jul","61","41","8","3"
"13-Jul","61","41","8","3"
"14-Jul","55","33","5","0"
"15-Jul","42","30","4","0"